As covered in yesterday’s post, I’ve got all the pieces I need to add choropleth map functionality to cendat–now I just need to put them all together. My biggest complaint about yesterday’s first attempt was the way the base map labels degrade because they’re raster graphics that you can only zoom in on. I speculated that it would probably be better to just plot labels directly, and that’s what’s covered here.
Place and (some) County Subdivision Centroids
In order to make it easy for users to orient themselves in choropleth maps, they need labels for cities, towns, etc. Depending on where you are in the U.S., that could imply incorporated places or a mix of incorporated places and county subdivisions (in some states, county subdivision areas represent official government entities, often called townships).
To label these entities, we need their names and the latitudes and longitudes representing their centroids. Thankfully, I can easily get that for all U.S. incorporated places and (meaningful) county subdivisions with single queries to the TIGERweb REST Service. Since this will be done within a new method of the CenDatResponse class, I will make sure to update CenDatHelper.get_data to pass the appropriate map server and layer IDs to the response object. But, once I have that, it’s a pretty straight-forward addition. The following continues the example started in yesterday’s post.
Get Places and County Subs Simultaneously in a 2-Worker Thread Pool
%%timefrom concurrent.futures import ThreadPoolExecutorimport geopandas as gpdimport pandas as pdimport requestsfrom collections import defaultdictimport matplotlib.pyplot as pltimport osfrom cendat import CenDatHelperimport contextily as ctxgeo_data = defaultdict(gpd.GeoDataFrame)def get_tiger_polygons( layer_id: int, where_clause: str, fields: str, service: str="TIGERweb/tigerWMS_Current",) -> gpd.GeoDataFrame: API_URL = ("https://tigerweb.geo.census.gov/arcgis/rest/"f"services/{service}/MapServer/{layer_id}/query" ) params = {"where": where_clause,"outFields": fields,"outSR": "4326","f": "geojson","returnGeometry": "false","returnCountOnly": "false","resultOffset": 0,"resultRecordCount": 100_000,"timeout": 60, }try: response = requests.get(API_URL, params=params) response.raise_for_status() geo_data[layer_id] = gpd.GeoDataFrame.from_features(response.json()["features"])print(f"✅ Successfully fetched {len(geo_data[layer_id])} centroids.")except requests.exceptions.RequestException as e:print(f"❌ HTTP Request failed: {e}")except (KeyError, ValueError) as e:print(f"❌ Failed to parse response JSON: {e}")print(f" Server Response: {response.text[:200]}...")try:with ThreadPoolExecutor(max_workers=2) as executor: future_places = executor.submit( get_tiger_polygons, 28, "1=1", "STATE,NAME,AREALAND,CENTLAT,CENTLON" ) future_countysubs = executor.submit( get_tiger_polygons,22, ("NAME LIKE '%township' OR ""NAME LIKE '%town' OR ""NAME LIKE '%village' OR ""NAME LIKE '%borough'" ),"STATE,NAME,AREALAND,CENTLAT,CENTLON", ) future_places.result() future_countysubs.result()exceptExceptionas exc:print(f"❌ A master fetching task failed: {exc}")
✅ Successfully fetched 19733 centroids.
✅ Successfully fetched 23060 centroids.
CPU times: user 295 ms, sys: 60.3 ms, total: 355 ms
Wall time: 3.63 s
Here we’ve used a generic function to fetch geography centroids, separately parameterized for places and county subs, in a thread pool, updating the geo_data dictionary as the data come in.
The latitude and longitude data come in as strings, so we need to convert those. We’ve also pulled the overall land area for our geographies, which we use (after converting to numeric) to create the rank groups variable NCILE. We’ll use this to filter down to the areas we want to label based on their area size.
Plot
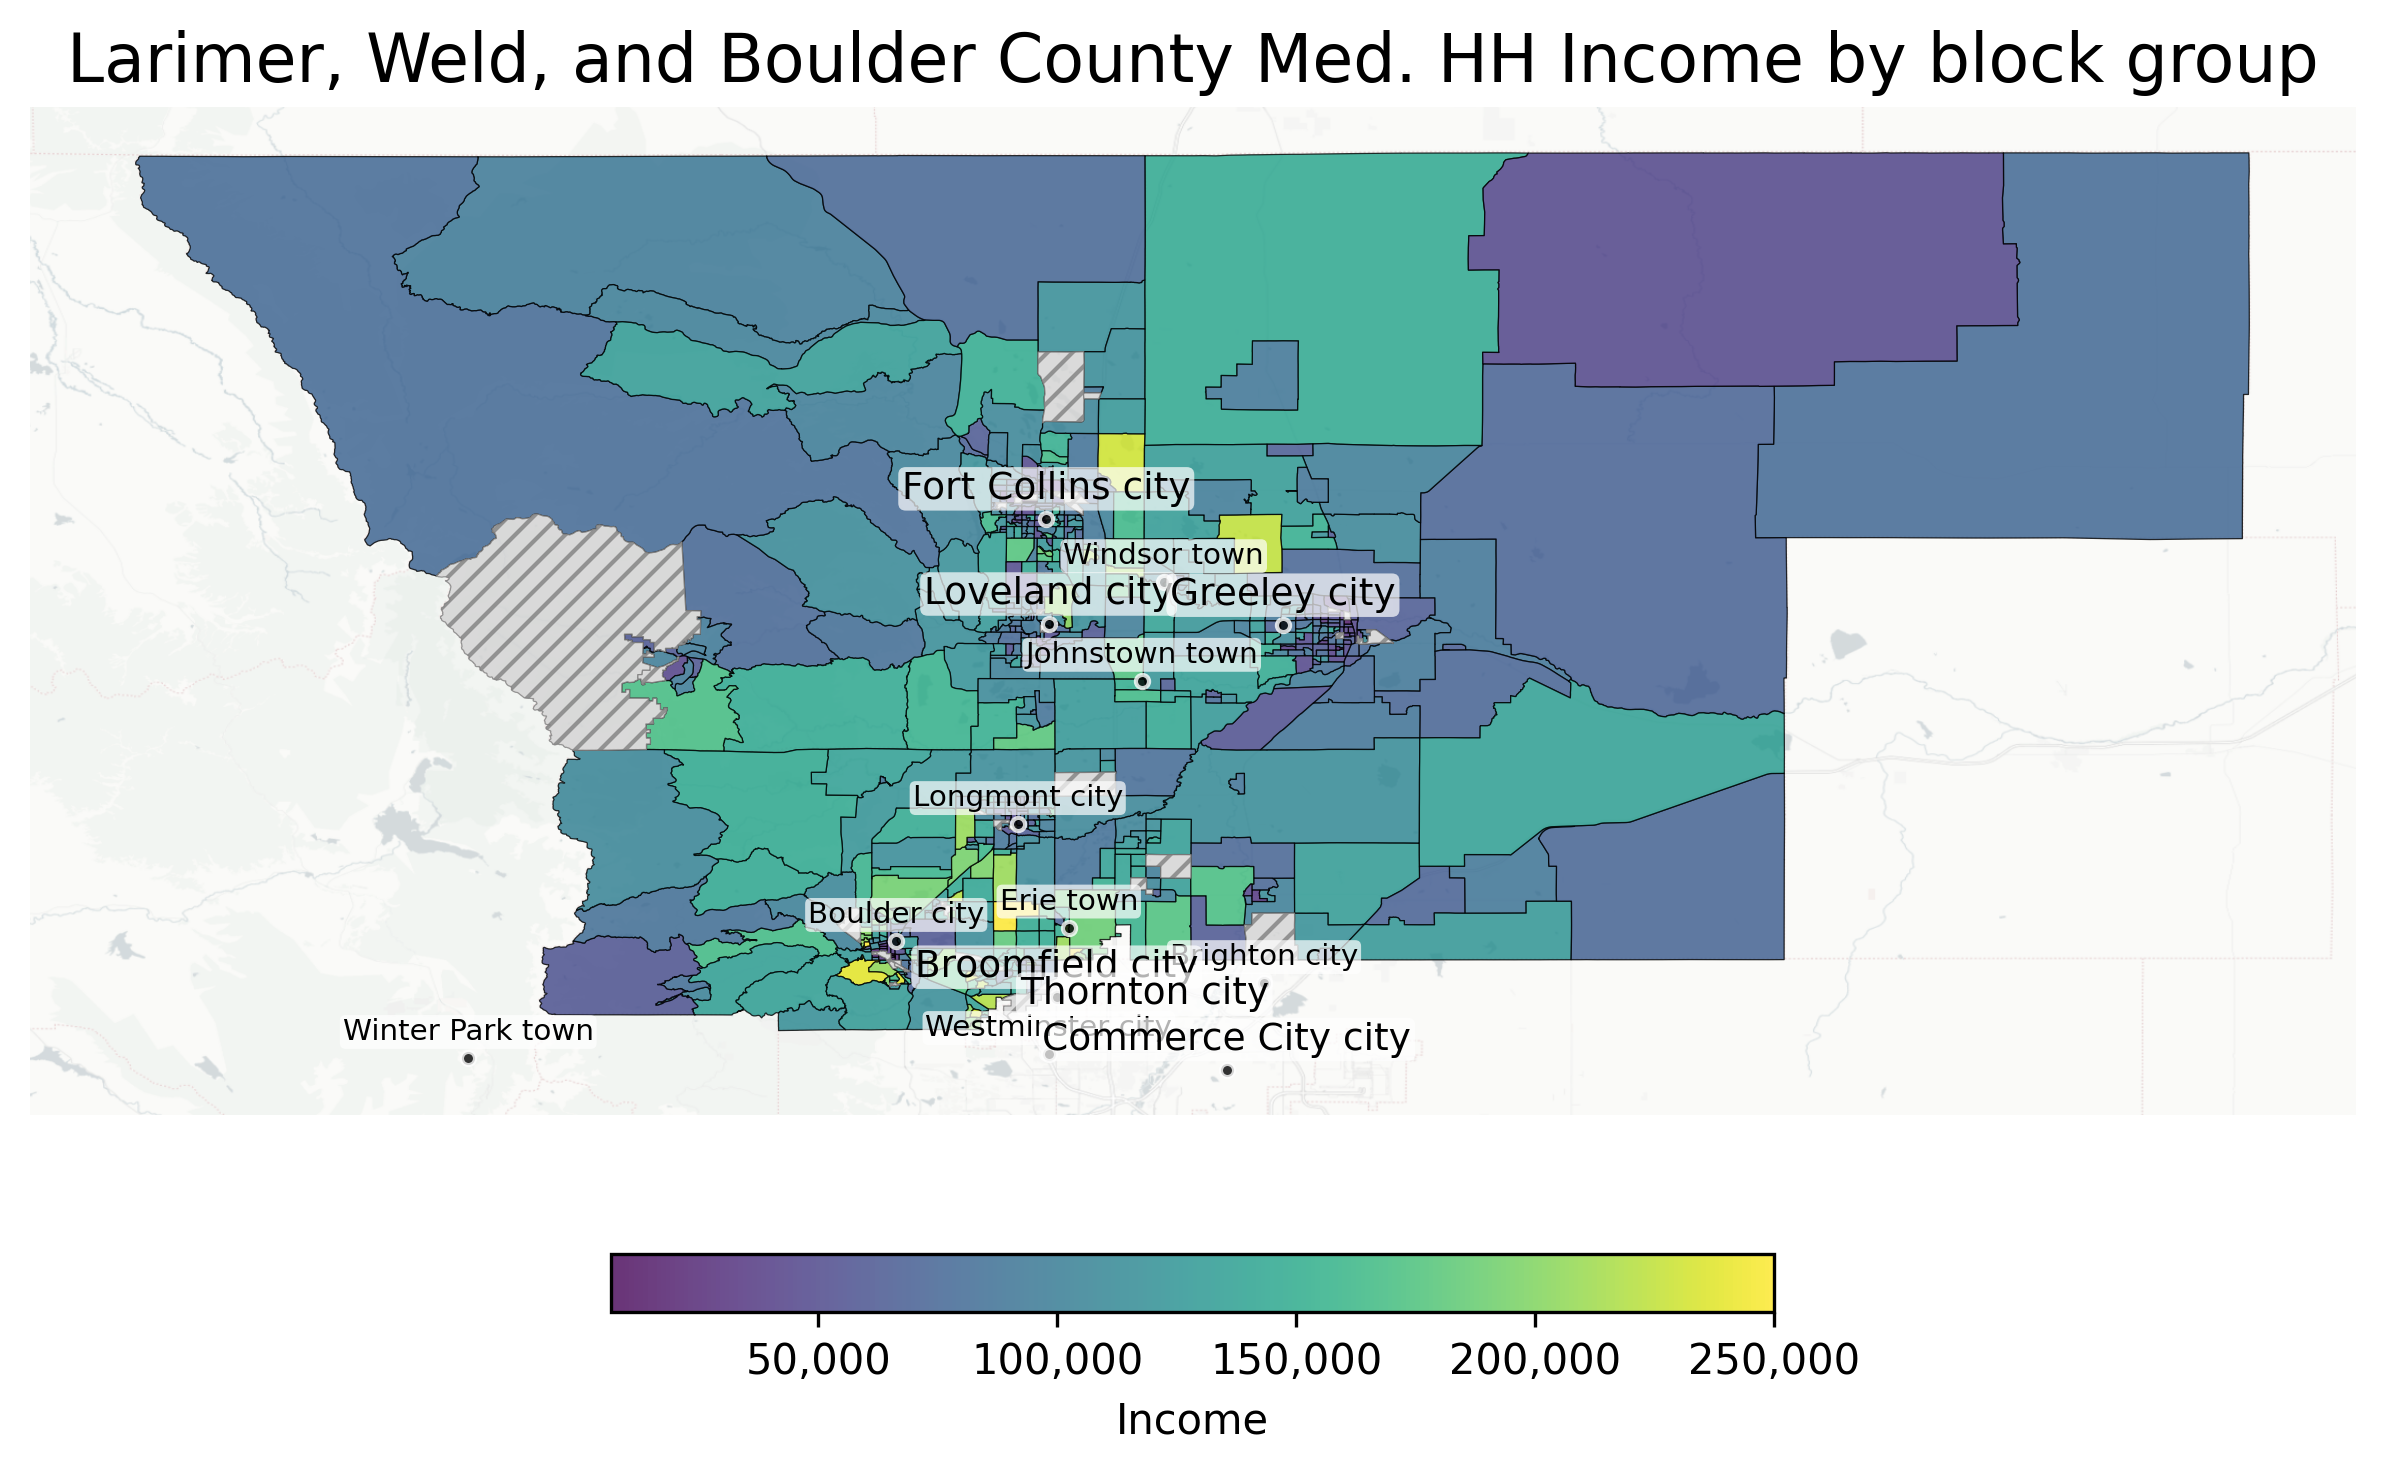
This builds directly off what we had yesterday, except I only use the unlabeled base map, adding labels directly from our centroids data.
I like this so much more! And, while it’s very difficult to avoid overlapping labels in a generalized context, I actually don’t mind them here. These plots are intended to have analytic utility, not really to be publication ready, and the combination of the white label backgrounds and transparency level makes them both useful and not too visually cluttered.
Citation
BibTeX citation:
@online{couzens2025,
  author = {Couzens, Lance},
  title = {Choropleths from {Census} {Data} {Pt.} 2},
  date = {2025-09-07},
  url = {https://mostlyunoriginal.github.io/posts/2025-09-07-cendat-to-choropleth-direct-labels/},
  langid = {en}
}